2025
INDUSTRY TRENDS REPORT
Unveiling New Perspectives:
Enhanced Industry Trends Through Strategic Acquisitions
Helping people recover faster while spending smarter isn’t just a goal – it’s an industry-wide imperative.
We’ve seen firsthand – through decades of experience in physical medicine – that recovery isn’t separate from financial outcomes. It drives them. The faster and more effectively people recover, the better the overall financial picture becomes.
Rising medical costs, provider consolidation, and evolving billing practices have created pressure on claims organizations to find better ways to ensure high-quality, cost-effective care. The challenge isn’t just about controlling expenses. It’s about rethinking how we approach care and payment models to drive meaningful results.
In this report, we look at different factors that show how working together to rethink care delivery and financial management can create solutions where better clinical outcomes drive smarter spending. Thanks to our strategic acquisitions over the past year, we now possess a unique perspective on medical trends, cost drivers, and industry-wide collaboration opportunities. These insights aim to ignite conversations about how we can collectively enhance patient recovery and achieve financial sustainability.

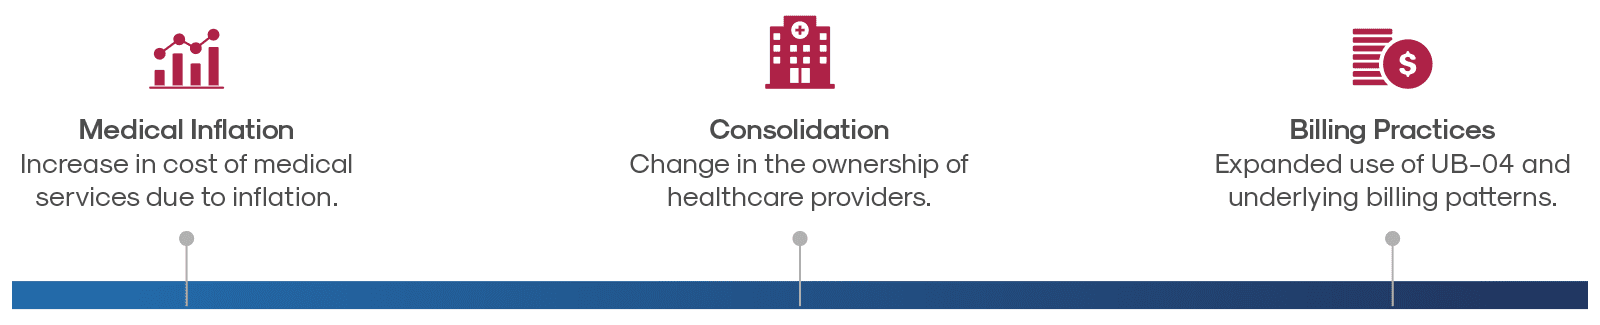
Healthcare’s Triple Threat to Smart Spending:
Medical Inflation, Provider Consolidation and Billing Practices
The healthcare landscape is experiencing unprecedented change as three interconnected forces reshape care delivery and costs. Provider consolidation into large health systems is accelerating medical inflation, while simultaneously enabling more complex billing practices that amplify cost increases. Our 2025 analysis reveals how these factors are creating compounding effects across workers’ compensation and the broader healthcare market.
Key Trends Driving Costs Across All Healthcare Sectors
Medical Inflation
Medical costs are rising faster than general inflation, creating a baseline increase in healthcare spending. Since 2000, the price of medical care (inclusive of services provided as well as insurance, drugs, and medical equipment) has increased 121.3%. In contrast, prices for all consumer goods and services rose by only 86.1% in the same period.
Key trends to watch:
- As providers consolidate into larger systems, they are gaining more leverage in rate negotiations, often leading to higher contracted prices. Traditional network contracts aren’t as effective at controlling these rising costs as they once were.
- Medical inflation is expected to continue to outpace general inflation, driven by other factors such as provider shortages and increasing administrative and technology costs.
The ability to offset inflation requires fresh approaches to managing medical costs while maintaining high-quality care, finding innovative solutions that balance fair provider compensation with reasonable costs for payers.
")
Source: KFF analysis of Bureau of Labor Statistics (BLS) Consumer Price Index (CPI) data

Sources: 1. KFF analysis of AHA hospital data from the AHA Annual Survey Database and the AHA Trendwatch Chartbook, 2021 and of American Medical Association (AMA) physician data from the AMA report “Recent Changes in Physician Practice Arrangements: Shifts Away from Private Practice and Towards Larger Practice Size Continue Through 2022.” 2. Gooch, Kelly. Becker’s Healthcare. “74% of physicians are hospital or corporate employees, with pandemic fueling increase.”
Healthcare System Consolidation
The U.S. healthcare landscape is undergoing a fundamental restructuring as consolidation reshapes how medical services are organized, delivered, and financed. This seismic shift is altering competitive dynamics, patient experience, and economic foundations of the entire healthcare ecosystem.
Key trends to watch:
- Independent medical practices are rapidly becoming part of larger health systems, changing the traditional care landscape.
- Private equity firms have entered the market aggressively, particularly targeting outpatient service providers and specialty practices.
- In response to these changes, many remaining independent providers are joining forces to create regional “super-groups,” allowing them to compete more effectively.
- Within the broader healthcare market, insurers are increasingly purchasing or partnering with provider networks, creating integrated systems that control both care delivery and payment.
This wave of healthcare consolidation will create both opportunities and challenges for workers’ compensation stakeholders, who must adapt strategies to ensure injured workers receive timely, appropriate care within increasingly concentrated provider networks.
Changes in Billing Practices
The medical billing landscape is undergoing a profound transformation with significant financial consequences, particularly for workers’ compensation systems. Provider organizations are strategically shifting from traditional HCFA 1500 forms toward UB-04 billing formats, a change that consistently yields higher reimbursements.
The impact is striking: In workers’ compensation, only 6.2% of bills are submitted using UB-04 formats, yet these bills drive 52% of total medical charges.
Key Trends:
- As independent practices are absorbed into larger health systems, they adopt more sophisticated billing methodologies, including complex procedure codes and additional facility fees.
- This billing evolution means identical medical services now often cost substantially more—not because the care itself has changed, but purely due to different billing classifications.
- Workers’ compensation fee schedules, designed for traditional billing patterns, frequently lack mechanisms to address these strategic billing modifications.
This systematic shift toward more complex billing practices directly impacts workers’ compensation costs, creating new challenges for claims management and cost containment.

In the past five years, we’ve seen an increase in bills per claim (8%), lines per claim (13%) and billed charges per claim (31%). This has resulted in 25% increase in costs between 2019 and 2024. During this same time period PPO savings decrease 3% on UB-04 bills.
Recovery Trends
Our comprehensive analysis reveals significant patterns in physical therapy utilization, surgical intervention rates, and treatment approaches across regions and injury types, reinforcing the central role of recovery in workers’ compensation outcomes.
Physical therapy plays a key role in the recovery process, with over 65% of musculoskeletal claims involving PT. As a critical driver of both clinical outcomes and costs, PT utilization has increased in recent years, largely due to the decline in opioid prescriptions and surgical interventions—both positive shifts in injury management. Beyond cost implications, PT remains essential to recovery, serving as a primary factor in helping injured employees regain function and return to work.
These clinical indicators serve as important barometers of healthcare delivery and highlight strategic opportunities to enhance care pathways for injured employees. While certain metrics remain consistent year-over-year, we’ve identified notable shifts that deserve careful attention from all workers’ compensation stakeholders. These emerging trends align with our broader vision of recovery-driven financial outcomes, where clinical excellence and cost management work in harmony.
Examination of Diagnosis and Geography on Time to PT and Time to Surgery

Time to PT
Research consistently demonstrates that early physical therapy (PT) intervention leads to superior outcomes. Early PT intervention results in faster return-to-work rates and fewer additional medical services, while significantly reducing overall claim costs by helping to prevent chronic conditions and avoiding unnecessary diagnostic testing or specialist visits.
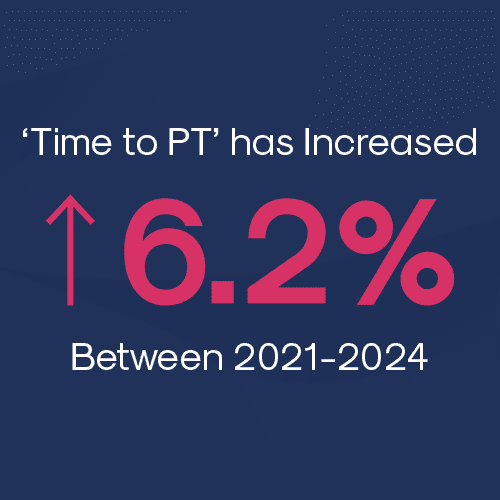
An analysis of the top ICD codes by case volume reveals a 6.2 percent overall increase in Average Time to PT between 2021 and 2024.
Multiple Factors Impact Speed to Physical Therapy
- Case complexity and severity levels
- Treatment sequencing decisions
- Injured employee and provider preferences for initial treatment approaches
- Administrative and authorization processes
- Care coordination between providers
Labor Market Considerations
While PT staffing challenges are not a primary driver of PT timing, recent data suggests it may be becoming more relevant in certain markets. The APTA’s 2024 benchmark report indicates that outpatient physical therapy practices continue to face staffing challenges, with a 9.5% total vacancy rate across all positions – nearly double the national average for all industries (4.8%). This varies significantly by region, with the Northeast showing a 16.3% vacancy rate compared to 7.6% in the Midwest. These staffing patterns could begin to impact appointment availability in some geographic areas.
Looking ahead, while staffing constraints may pose increasing challenges in certain markets, they remain secondary to other factors in determining time to PT. However, continued monitoring of regional labor market trends will be important as practices work to maintain adequate staffing levels and appointment availability.
Diagnosis-Specific Patterns
Pain-related cases often show longer times to PT initiation.
Key Insights:
- Neck injuries take the longest to get to PT among high-volume diagnoses. This typically reflects standard treatment protocols where patients first attempt alternative management.
- The distinction between more precise diagnoses of strain versus more generalized diagnoses of pain significantly impacts time to PT. Cases diagnosed as strain of the lower back (ICD S39.012D) reach physical therapy 37% faster than those diagnosed as lower back pain (ICD codes M54.50, M54.59 and M54.51). This marked difference likely reflects the clearer treatment pathway for acute strains, where early PT intervention is often prioritized, versus pain diagnoses which may first be treated through other conservative measures or require additional diagnostic workup to determine the underlying cause.


If you would like to see more state-specific data, contact MedRisk at marketingsupport@medrisknet.com.
Geographic Variations
Analysis of the top five states by case volume reveals regional disparities in PT access:
Key Insights:
- California has the longest Average Time to PT at 90.7 days
- Florida follows with 81.4 days (11% faster than California)
- Pennsylvania (which is in the top ten states by case volume but not graphically depicted) demonstrates notably better Average Time to PT performance at 54.7 days (66% faster than California)
These significant state-level variations suggest that local healthcare delivery systems, regulatory environments, and claims management practices play a crucial role in determining how quickly injured workers access physical therapy services.
Surgical Rate Trends
Within the broader healthcare market, providers are increasingly favoring conservative treatment approaches before considering surgical intervention. This is supported by growing evidence that many conditions can be effectively managed through physical therapy and other non-invasive treatments.
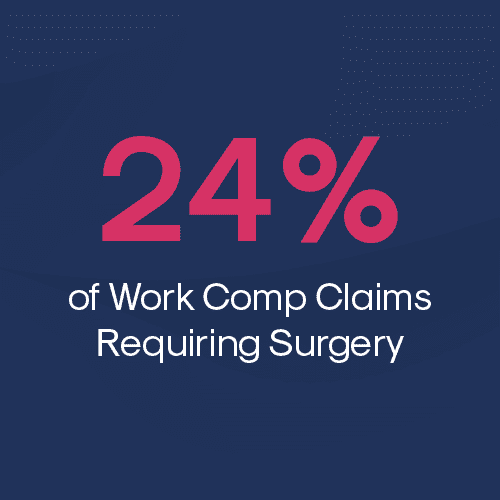
Despite these broader market trends, we are not seeing a decline in surgical rate trends in workers’ compensation, with the proportion of claims requiring surgery remaining stable at approximately 24 percent of claims between 2021 – 2024.
Procedure-Specific Patterns
Despite the overall proportion of claims requiring surgery remaining stable, two common arthroscopy procedures show positive declines in surgical rates.
57%
Decline in surgical rates
for shoulder arthroscopy
8.5%
Decline in surgical rates
for knee arthroscopy
These reductions in arthroscopic procedures for the shoulder and the knee reflect growing adherence toward more conservative initial treatment approaches. This trend not only reduces potentially unnecessary surgical interventions but can also lead to improved patient outcomes.
Geographic Variations in Time to Surgery
Key Insights:
- California, which also has the longest Average Time to PT at 90.7 days, also shows the longest time from Date of Injury (DOI) to date of surgery (DOS) at 162.2 days. This time gap suggests systemic factors affecting both physical therapy and surgical care access in the state.
- California’s Time to Surgery rates contrast sharply with other high-volume states (FL, GA, NJ, NC) that average 119.4 days from DOI to DOS – 35% faster access to surgical intervention.
Time to PT is quicker than time to surgery, driven by multiple factors, including:
- Less complex authorization requirements for PT compared to surgery
- PT being a common first-line conservative treatment approach
- Lower barriers to scheduling PT versus coordinating surgical interventions
- Many cases successfully resolve with PT, eliminating the need for surgery

If you would like to see more state-specific data, contact MedRisk at marketingsupport@medrisknet.com.
The regional variations in access to both PT and surgery suggest state-specific factors like regulatory requirements, healthcare delivery systems, and provider networks play significant roles in determining treatment timelines.
Research & Insights
Stay current with the latest research shaping musculoskeletal care and workers’ compensation outcomes. These peer-reviewed studies offer valuable insights into social determinants of health, recovery patterns, and treatment efficacy, and workplace support factors – information that can help inform evidence-based clinical decision making and improve injured employee care.
Recommended Reading


Conclusion:
Adapting and Innovating for a Smarter, Healthier Future
In an industry challenged by consolidation and rising costs, one thing is clear: standing still is not an option. These trends are reshaping the healthcare and workers’ compensation landscape, bringing both challenges and opportunities. To stay ahead, we have to rethink old approaches, find smarter solutions, and adapt to a system that’s evolving whether we’re ready or not.
The good news? Innovation is already happening. By embracing change, testing new strategies, and focusing on what truly moves the needle—better recovery outcomes and smarter cost management—we can turn these shifts into successes for everyone involved. The future of workers’ comp isn’t just about keeping up; it’s about leading the way.
MedRisk by the Numbers
MedRisk, with SPNet, Medata, and StrataCare, is dedicated to lowering costs and accelerating recovery for injured workers in the casualty claims industry. As medical costs rise, MedRisk addresses these challenges with innovative managed care, payment integrity, and network solutions powered by data, AI, and analytics. Through care direction, care engagement, payment integrity solutions, networks and negotiations, payment solutions, and insights management, we ensure high-quality, timely care—enabling faster, seamless recoveries for patients and reducing administrative burden for adjusters and case managers. Here’s a closer look at MedRisk based on 2024 data:
At MedRisk, we’re constantly delving into research, analyzing data, and leveraging our long-standing expertise to turn these possibilities into concrete solutions for our valued customers and partners.
30M+
Total Bills Processed
591k+
Patients Treated
150k+
Providers In Network
Why Research Matters
The workers’ compensation landscape, as we’ve shown, is ripe with opportunities to optimize for both financial and medical success. Progress thrives on out-of-the-box thinking, and we’ve pinpointed key areas where collective action can show its full potential. Through collaboration, we can not only achieve improved financial results but also accelerate patient recovery, paving the way for a collective win.
At MedRisk, we’re constantly delving into research, analyzing data, and leveraging our long-standing expertise to turn these possibilities into concrete solutions for our valued customers and partners.